Hi! I'm Slowby's Chief Technologist
Slowby is a social enterprise from Belgium that makes slow travel more accessible. We mainly work on the hospitality platform Welcome To My Garden, but we also have several other projects.
Welcome To My Garden
), and a simple chat system to contact hosts.
WTMG is [member-supported](https://welcometomygarden.org/about-membership). Aside from being able to send stay requests, members get access to extra tools like uploading `.gpx` files to find gardens along a planned trail, a community space with likeminded travellers, a railway transportation map, and more!](/static/fc715738cc755def6f17292b042ecfd3/f21cb/wtmg_6f54cd3d4a.png)
Founded during the corona summer of 2020, WTMG is a community platform where slow travellers can find a camping spot in people's gardens.
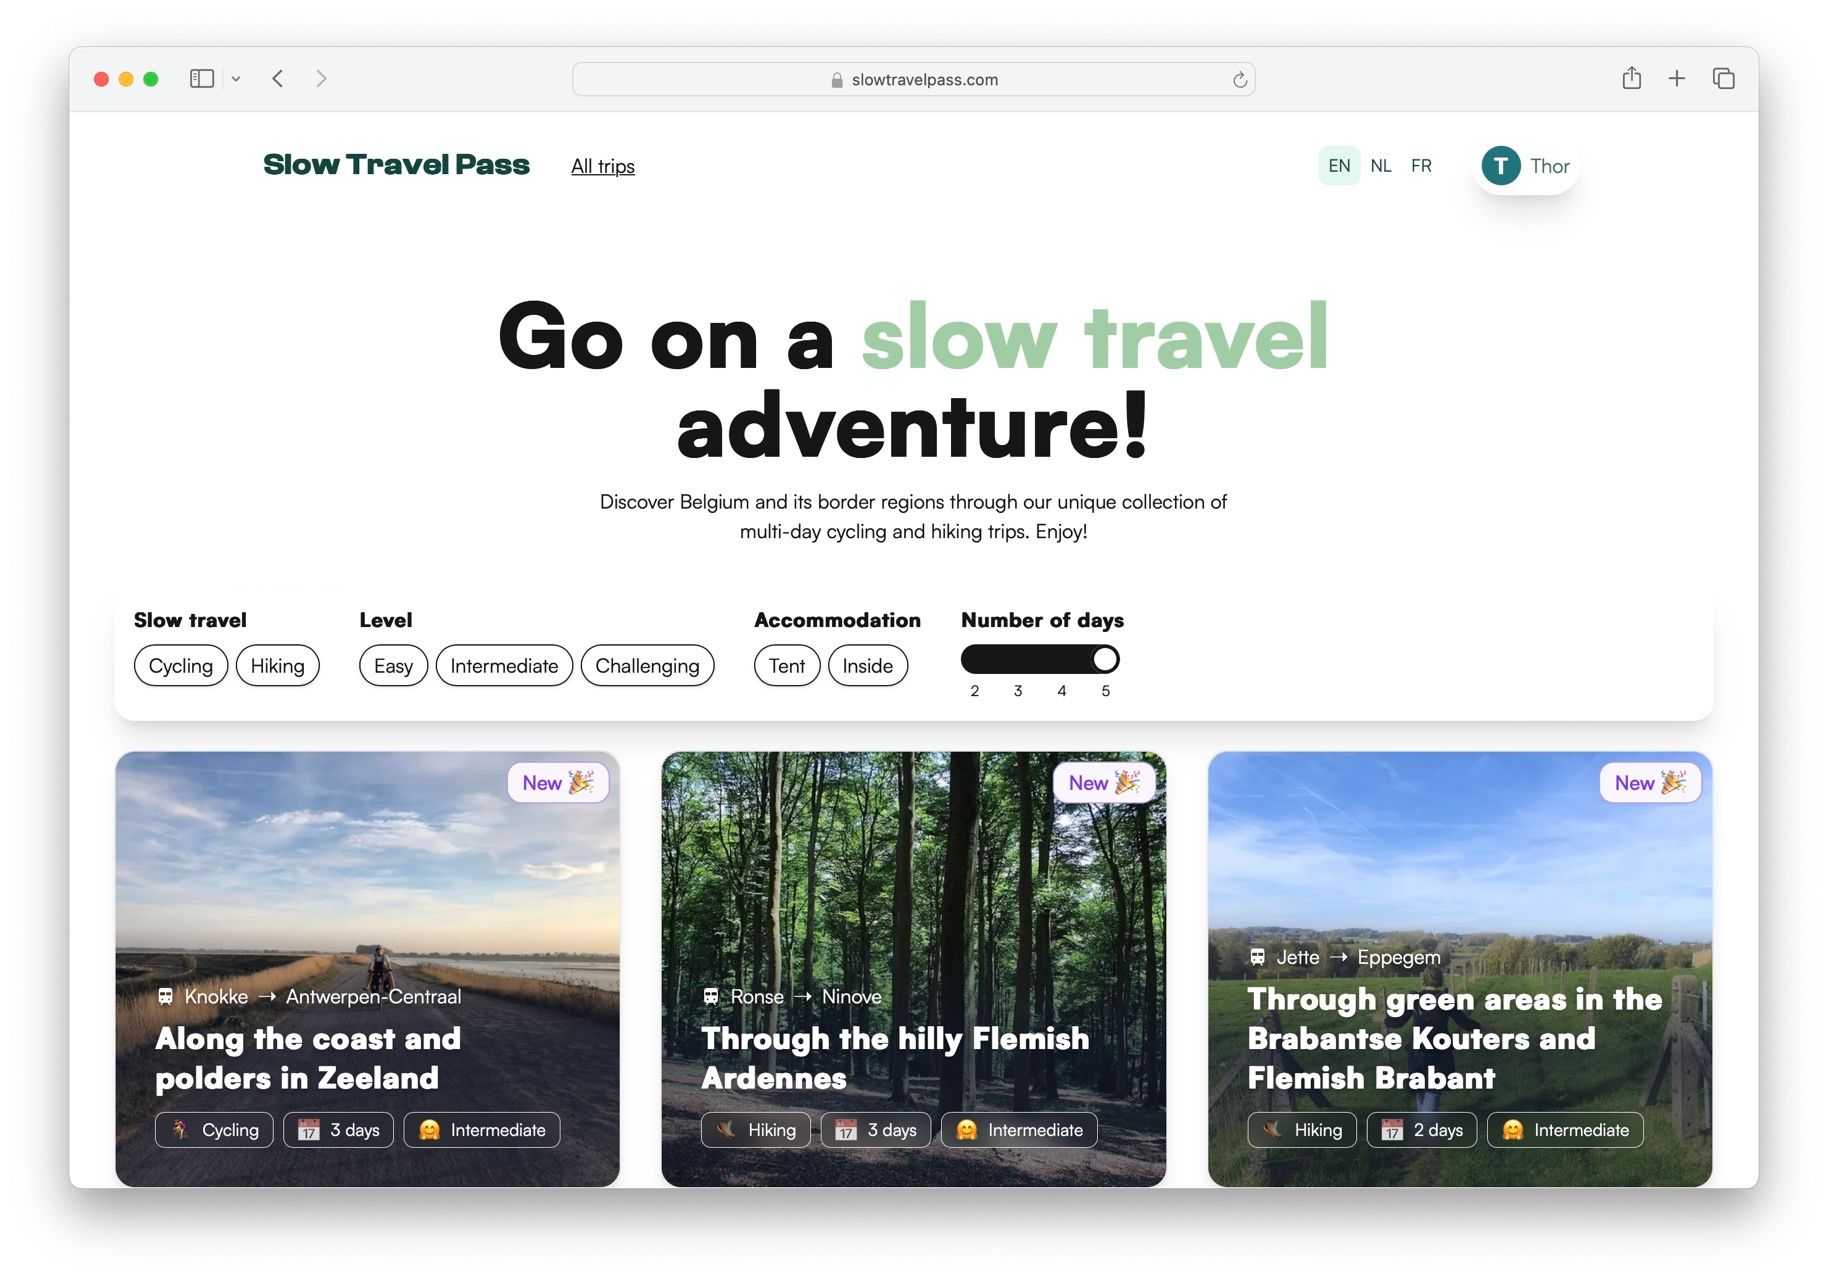
Slow Travel Pass

A website with complete trip plans for 25+ slow travel trips in Belgium.
Women Don't Cycle (documentary)
. It is a film about what it means to be a woman cycling in different countries around the world.
The documentary was shot during an eleven-month bicycle touring trip from Brussels to Tokio, with Slowby's other co-founder [Dries](https://www.linkedin.com/in/driesvanransbeeck) (for more about their trip, see [_Road to the Rising Sun_](https://roadtotherisingsun.be/)).](/static/d61dc36d986fee9dd4bbe6dd36a454ee/36a5a/Women_Don_t_Cycle_ced894520a.jpg)
A documentary about what it means to be a woman cycling in different countries around the world.
Previously...
I worked in consulting at Columbia Road & front-end & more at Readup.
Read more about my past work →I also hack on projects for fun 👀
I've recently worked on...
And, here's a selection of past projects, both recent and older.
Mealime/Siri integration 2022 → 2023
. It abstracts away cookie-based authentication into a simple fixed token, so the API can be used from an iOS Shortcut and other simple HTTP clients.
Amongst others, I used this Shortcut to build a grocery list integration with Siri: I can now add items to my grocery list without picking up my phone, and I often do!
In February/March 2023, I rewrote the Node.js app into Deno, extended its functionality, and released it publicly on GitHub.](/static/62b9c0aad47fbff82532afe34751ab04/b21a6/mealime_6d4894e3c8.png)
An unofficial Mealime API wrapper for usage with Siri via Apple Shortcuts.
Dash 2020
 for my personal projects at the time, and the [Harvest API](https://help.getharvest.com/api-v2/) for my Columbia Road work projects at the time.
- Time goals, which I set in the dashboard, for projects I wanted to commit to at the time. For example, "I want to learn Swedish for 6 hours per week" would be a goal.
The widget then showed my progress towards the goal of each project in a progress bar, dividing the time goal equally over each weekday. With colors, it visually represented how much I was on- or off-balance:
- <span style="color: blue;">Blue</span> meant: completed according to schedule
- <span style="color: red;">Red</span> meant: overdue, should have been done.
- <span style="color: gold;">Yellow</span> meant: to be done today.
- <span style="color: green;">Green</span> meant I "overshot" the goal, or did more than planned given this distribution (can be a bad thing!).
I used this for about two months, and I felt it did help me to achieve a better balance. A new tab page is one you see often, so I would get reminded of my undershooting and overshooting all the time, which would steer my behavior.
I wanted to take this step further, according to my original designs: what if you didn't just set a fixed number of hours as a project goal for a week/month, but would also integrate it with your digital calendar?
Then the tool would help you in more ways:
- When planning, you could add, re-scale and reshuffle calendar events for each project, until each project reached the desired quota of time: _"Is your calendar sound? Does it match your intentions?"_
- Your expectations for a day would be more fine-tuned: the dashboard wouldn't nudge you to work on a project on Tuesday or Wednesday if you wanted to complete it all Thursday.
- When your calendar changed, as it often does, you would see the impact it had on your overall distribution of time for a week/month, and you'd be better informed to make resulting changes.
But while getting somewhere, I had not finished this part of the implementation. Along the way though, I saw more opportunities for this Dashboard that I did try out.
## The "Streaks" Widget
Not everything ought to take a distinguishable number of hours in a weekly plan. A habit can be a small thing, like practicing on Duolingo for a few minutes each day. For these types of commitments, I added a "streaks" widget.
I picked two external services that I wanted to use daily at the time. Both had a "streaks" concept of their own.
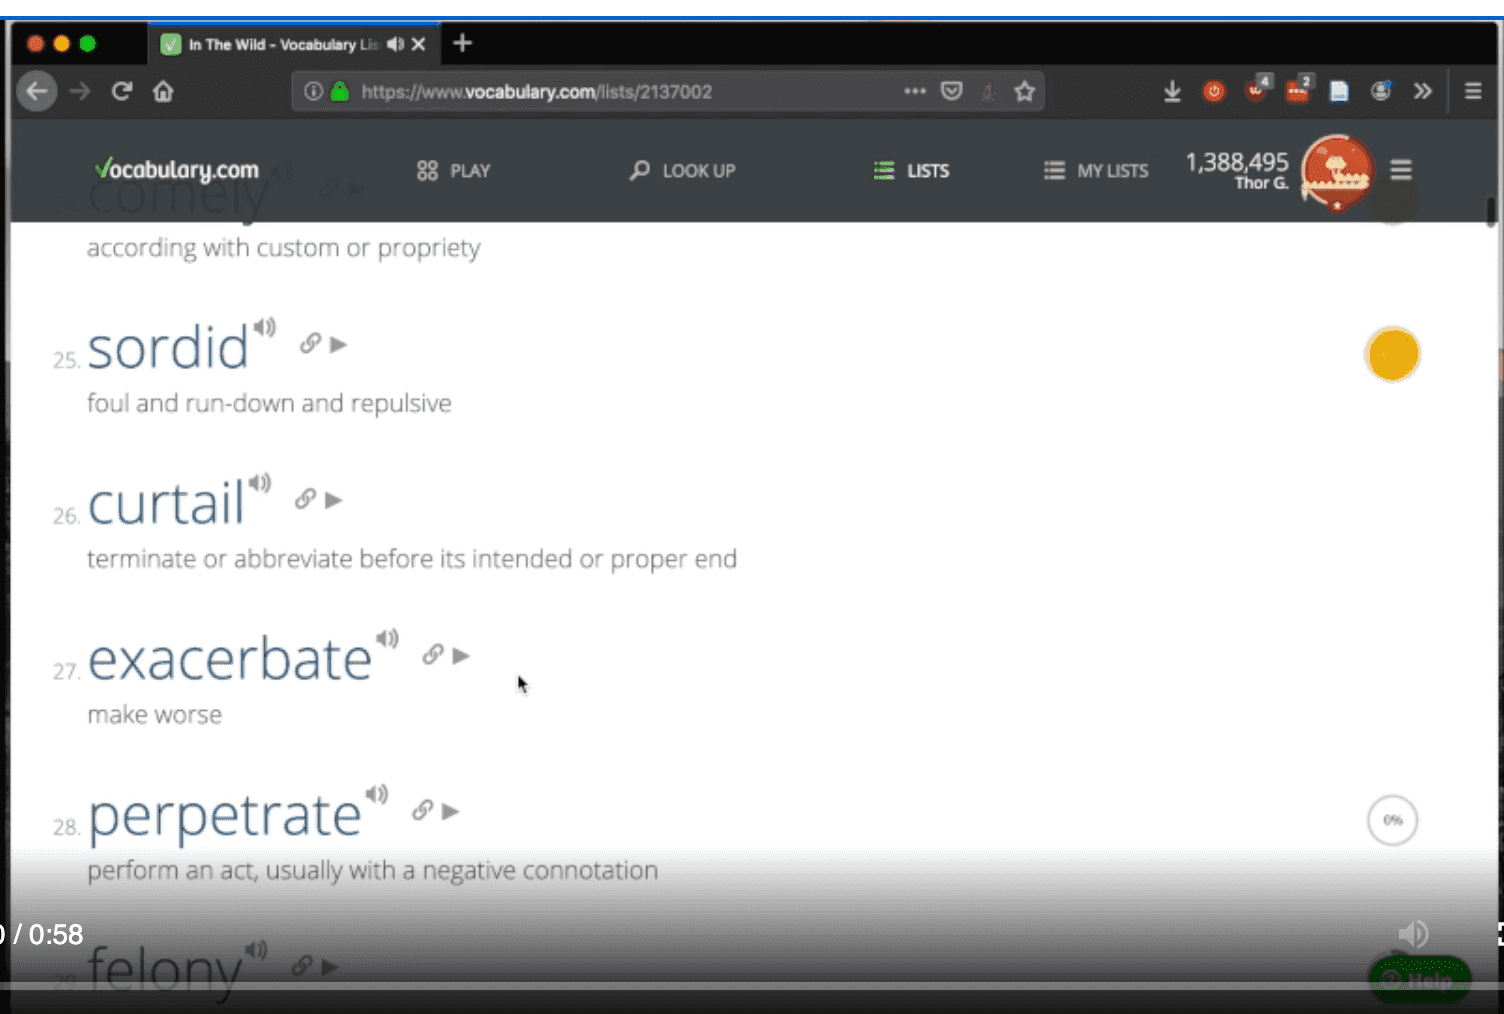
- First, there was Vocabulary.com, the object of my [Vocabulary.com Enhancer tools](/projects/vocabulary-com-tools/). The entry would also link to my last-practiced list, so I could directly jump into the next session.
- Next, there was Readup.com (for which I didn't work yet at the time). Similarly, it showed my last Starred article.
Neither of these had a public API, however. This sparked some creative web engineering to retrieve arbitrary authenticated web app HTML from these sources. I used a web extension to proxy privileged requests with my cookies/credentials to my "new tab" page, which inconveniently was a regular web page. It needed to be a regular web page, because I relied on the Service Worker's Cache API to cache requests for quick loads, and that was not supported in extension pages at the time.
## The book widget
The last widget I added was the book widget. I didn't only want to track time spent on my computer, but also time spent learning otherwise: through books, or audio books, and bring it fairly into consideration along with the rest.
Using the same proxy extension, I could parse my progress on audio books with Audible's web app (see [this post](/articles/regex-puzzle-either-and/) on a regex challenge therein). I could then set a time goal to finish my book by a certain date. I also worked on fetching progress from Kindle's web app, but if I remember correctly, couldn't sufficiently reverse-engineer the web app to extract my progress.
## Conclusion & legacy
I used a development build of this project for some months as my daily-driver new tab, and enjoyed it! It helped me. However, after some time, I got stability problems with some widgets. Building unofficial APIs for personal data through web scraping does not guarantee stability, as HTML structures might change at any point. Other work encroached; I submitted my thesis, became a full-time employee at [Columbia Road](/work/#Columbia-Road), and _Dash_ faded out of focus.
I've re-pondered this concept sporadically ever since, so I might revisit it at some point.
### Potential
About a year after shelving this project, I learned about [Potential](https://potential.app), a humane tech start-up building a habit _forming_ app aligned well with what I had dreamed of for Dash. I tried out the app, and quickly started enjoying it. Potential also had a (much better designed) widget with automatically-updating streak counts, such as for Duolingo. I contacted their CEO, to present _Dash_ as a reference for a possible expansion of Potential into the web browser. Some discussion ensued.
Not much later, Potential opened a role for a Software Engineer. I got the job! (at least, for a few fun months, until it got cancelled by [some complicated times](https://welf.substack.com/p/its-over-were-so-back-potential-2024))](/static/ecbfe0e503c3303117a97240b61549ad/e103f/dash_demo_0b87f276f2.png)
A "new tab" dashboard with widgets driven by personal data from various sources, to keep track of your commitments & habits.
Vocabulary.com Tools 2018 → 2020

A suite of tools to enhance English language learning on vocabulary.com.
Movie Visualization 2018 → 2019
.](/static/cf0801a66332f6fb4aa8e0d6aa13066e/d0392/movieviz_tiles_12257f373b.jpg)
An interactive visualization of movies I watched during 2015-2018, with some commentary.
. If you're interested in extending operating system or browser support, check out the [notes for contribution](https://codeberg.org/thor/browser-history-explorer/src/branch/main/CONTRIBUTING.md).](/static/be15ac78c51dad3cf5c219da0f49eb11/8c5e7/screenshot_758a6c44e9.png)
, or my own Readup profile at [readup.org/@thorgalle](https://readup.org/@thorgalle)
<!-- These readers readers can get informed and inspired at their own pace. -->](/static/dd55a4e8aac356a868aeb36f414ac5f8/512df/Clean_Shot_2023_04_16_at_16_33_11_2x_3faa39da5a.png)